Reading and Writing External Files in MATLAB
MATLAB provides powerful tools for handling external files. You can read data from and write data to various file formats such as text files, spreadsheets, and binary files.
Reading Files
MATLAB supports multiple functions to read external files. Here are some examples:
Reading Text Files
% Reading a text file

fileID = fopen('example.txt', 'r'); % Open the file in read mode

data = fread(fileID, '*char')';    % Read the content as characters

fclose(fileID);                   % Close the file

disp(data);
Example Output:

This is an example content from the text file.
Reading CSV Files
% Reading a CSV file

data = readmatrix('example.csv'); % Reads numerical data from a CSV file

disp(data);
Reading Excel Files
% Reading an Excel file

data = readtable('example.xlsx'); % Reads data into a table

disp(data);
MATLAB also allows you to select files interactively using a file chooser window. This is useful for cases where you need to allow users to choose a file dynamically instead of hardcoding file paths.
Windoows like File Upload example in MATLAB, using uigetfile for File Selection
The uigetfile function opens a dialog box to let users select a file. Here’s an example:
% Interactive file selection

[filename, pathname] = uigetfile({'*.txt;*.csv;*.xlsx', 'Supported Files (*.txt, *.csv, *.xlsx)'; '*.*', 'All Files (*.*)'}, ...

                                   'Select a File');


% Check if the user pressed Cancel

if isequal(filename, 0) || isequal(pathname, 0)

    disp('User cancelled the file selection.');

else

    fullpath = fullfile(pathname, filename);

    fprintf('File selected: %s\n', fullpath);


    % Example of reading the file if it's a text file

    if endsWith(filename, '.txt')

        fileID = fopen(fullpath, 'r');

        content = fread(fileID, '*char')';

        fclose(fileID);

        disp('File content:');

        disp(content);

    else

        disp('This example currently supports only text files for reading.');

    end

end
Example Scenario:

1. A file chooser window will open.

2. Select a text file (e.g., example.txt).

3. The file's content will be displayed in the MATLAB command window.

Example Output:

File selected: C:\Users\YourName\Documents\example.txt

File content:

This is a sample text file content.
Writing Files
You can also write data to files using MATLAB:
Writing to Text Files
% Writing to a text file

fileID = fopen('output.txt', 'w'); % Open the file in write mode

fprintf(fileID, 'Hello, MATLAB!\nThis is a new file.');

fclose(fileID);                   % Close the file
Check the output.txt file for the content written.
Writing to CSV Files
% Writing to a CSV file

data = [1 2 3; 4 5 6; 7 8 9];

writematrix(data, 'output.csv'); % Writes the matrix to a CSV file
Writing to Excel Files
% Writing to an Excel file

data = table(["John"; "Alice"; "Bob"], [23; 25; 28]);

data.Properties.VariableNames = {'Name', 'Age'};

writetable(data, 'output.xlsx'); % Writes the table to an Excel file
Advanced File Handling
MATLAB also supports more advanced file handling techniques:
Appending Data to Files
% Appending data to a file

fileID = fopen('output.txt', 'a'); % Open the file in append mode

fprintf(fileID, '\nAppending more text to the file.');

fclose(fileID);                   % Close the file
Reading and Writing Binary Files
% Writing binary data

fileID = fopen('binaryfile.dat', 'w');

fwrite(fileID, [1.1, 2.2, 3.3], 'double');

fclose(fileID);


% Reading binary data

fileID = fopen('binaryfile.dat', 'r');

data = fread(fileID, 'double');

fclose(fileID);

disp(data);
Example Output:

    1.1000
    2.2000
    3.3000
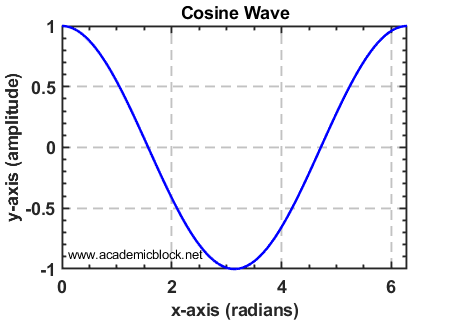
Creating and Saving a Plot as an Image in MATLAB
MATLAB allows you to create high-quality plots and save them as image files with custom dimensions and resolution. This can be useful for presentations, publications, or sharing visual data.
Here is an example script that generates a sine wave plot and saves it as an image with user-specified dimensions and resolution:
% User-defined parameters

width = input('Enter the width of the image in pixels: ');

height = input('Enter the height of the image in pixels: ');

dpi = input('Enter the resolution (DPI): ', 's');

dpi = str2double(dpi);


% Generate a sine wave plot

x = linspace(0, 2*pi, 1000);

y = cos(x);

figure;  % Create a new figure window

plot(x, y, 'b', 'LineWidth', 1.5);

title('Cosine Wave');

xlabel('x-axis (radians)');

ylabel('y-axis (amplitude)');

grid on;


% Customize and save the figure

set(gcf, 'PaperUnits', 'inches');

set(gcf, 'PaperPosition', [0 0 width/96 height/96]); % Convert px to inches (1 inch = 96 px)

filename = 'CosineWave.jpg';

print(filename, '-djpeg', ['-r', num2str(dpi)]);


disp(['Image saved as ', filename, ' with size ', num2str(width), 'x', num2str(height), ' pixels at ', num2str(dpi), ' dpi.']);
Example Scenario:

1. Run the script in MATLAB.
2. Enter the desired width, height, and resolution (DPI) when prompted.
3. A sine wave plot will be generated and saved as "sine_wave.jpg" in the current working directory.

Example Output:

Enter the width of the image in pixels: 800
Enter the height of the image in pixels: 600
Enter the resolution (DPI): 300

Image saved as sine_wave.jpg with size 800x600 pixels at 300 dpi.
Useful MATLAB Functions for File Operations
Practice Questions
Test Yourself
1. Write a MATLAB script to read data from a CSV file and compute the sum of all values.
2. Create a binary file with floating-point data and read it back.
3. Write a MATLAB script to append text to an existing text file.