Basic Statistical Analysis in MATLAB
MATLAB provides powerful tools for statistical analysis, enabling users to compute descriptive statistics, perform hypothesis testing, analyze data trends, and visualize results. This section covers common statistical operations with examples and outputs.
Descriptive Statistics
MATLAB makes it simple to compute basic statistics like mean, median, variance, and standard deviation. Here’s how:
% Sample Data

data = [12, 15, 20, 22, 25, 28, 30];

% Calculate Mean

mean_val = mean(data);

disp(['Mean: ' num2str(mean_val)]);

% Calculate Median

median_val = median(data);

disp(['Median: ' num2str(median_val)]);

% Calculate Variance

var_val = var(data);

disp(['Variance: ' num2str(var_val)]);

% Calculate Standard Deviation

std_val = std(data);

disp(['Standard Deviation: ' num2str(std_val)]);
Outputs for the given data:
Mean: 21.7143
Median: 22
Variance: 42.5714
Standard Deviation: 6.5255
Data Summarization
You can quickly summarize datasets using built-in MATLAB functions such as sum, min, and max:
% Summarizing data using sum

data_sum = sum(data);

disp(['Sum: ' num2str(data_sum)]);

% Finding Minimum and Maximum

data_min = min(data);

disp(['Minimum: ' num2str(data_min)]);

data_max = max(data);

disp(['Maximum: ' num2str(data_max)]);
Outputs for the given data:
Sum: 152
Minimum: 12
Maximum: 30
Correlation and Covariance
Correlation and covariance are measures of the relationship between two datasets. MATLAB provides built-in functions to compute these:
% Sample Data

x = [1, 2, 3, 4, 5];

y = [2, 4, 6, 8, 10];

% Calculate Correlation

corr_val = corrcoef(x, y);

disp('Correlation Matrix:');

disp(corr_val);

% Calculate Covariance

cov_val = cov(x, y);

disp('Covariance Matrix:');

disp(cov_val);
Outputs:
Correlation Matrix:
    1.0000    1.0000
    1.0000    1.0000

Covariance Matrix:
    2.5000    5.0000
    5.0000   10.0000
Probability Distributions
Probability distributions like normal and uniform distributions are commonly used in statistical modeling. MATLAB makes it easy to generate and analyze these:
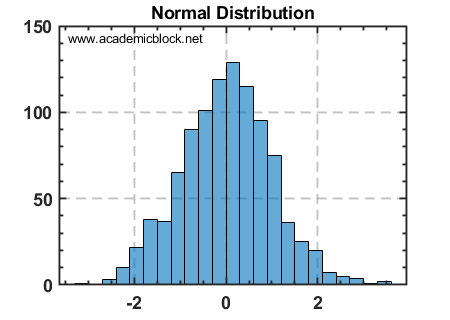
% Generating Normally Distributed Random Numbers

normal_data = randn(1, 1000);

disp('Generated Normal Distribution Data');

disp(normal_data(1:5)); % Display first 5 values

% Generating Uniformly Distributed Random Numbers

uniform_data = rand(1, 1000);

disp('Generated Uniform Distribution Data');

disp(uniform_data(1:5)); % Display first 5 values

% Display Histogram

histogram(normal_data);

title('Normal Distribution');
Output: A histogram representing normally distributed random numbers will be displayed. Experiment with different datasets to observe varying distributions.
Hypothesis Testing
MATLAB allows you to perform hypothesis testing, such as the t-test, to validate assumptions about datasets:
% Sample Data

data1 = [2.3, 3.1, 3.8, 4.5, 5.2];

data2 = [2.1, 3.0, 3.5, 4.7, 5.0];

% Perform t-test

[h, p] = ttest(data1, data2);

disp(['Hypothesis Test Result (h): ' num2str(h)]);

disp(['p-value: ' num2str(p)]);
Outputs:
Hypothesis Test Result (h): 0
p-value: 0.5642
The output suggests no significant difference between the two datasets as the p-value is greater than 0.05.
Useful MATLAB Functions for Statistical Analysis
mean(data) computes the average value of the dataset.median(data) computes the median value of the dataset.std(data) computes the standard deviation of the dataset.var(data) computes the variance of the dataset.corrcoef(x, y) calculates the correlation coefficient matrix between two datasets.cov(x, y) calculates the covariance matrix of two datasets.ttest(data1, data2) performs a paired t-test.histogram(data) creates a histogram for the given dataset.Practice Questions
Test Yourself
1. Compute the mean, median, variance, and standard deviation of a dataset of 20 random numbers.
2. Generate a 1×500 array of normally distributed random numbers and plot its histogram.
3. Find the correlation and covariance between two datasets of equal size.
4. Perform a paired t-test on two datasets to check for significant differences.